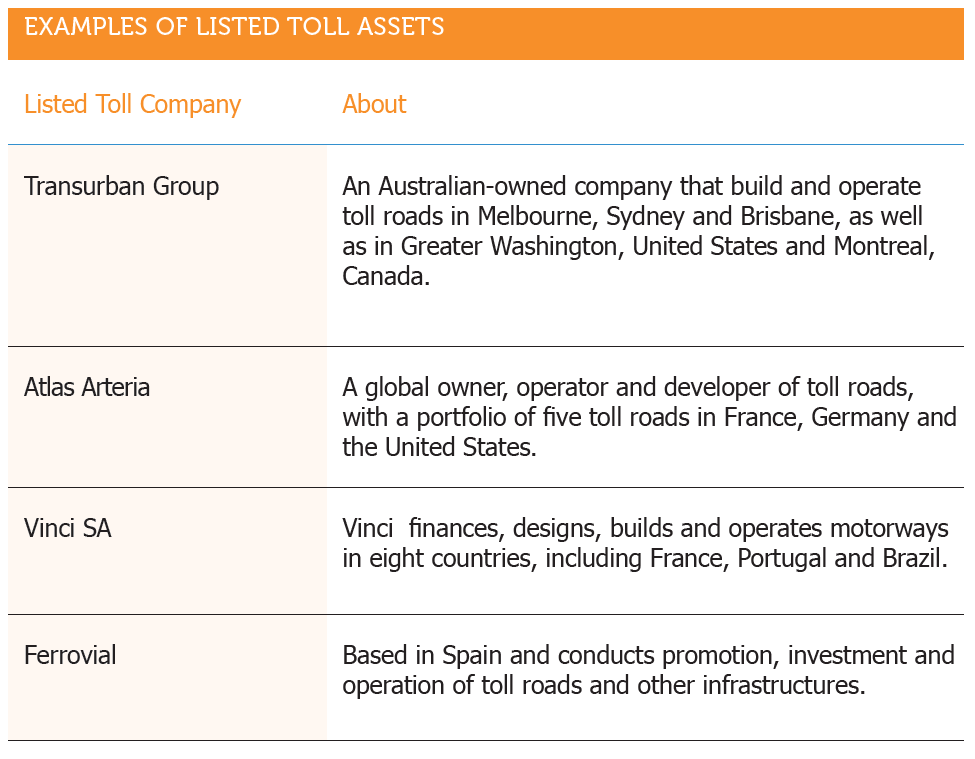
Investing in toll roads

Types of toll roads
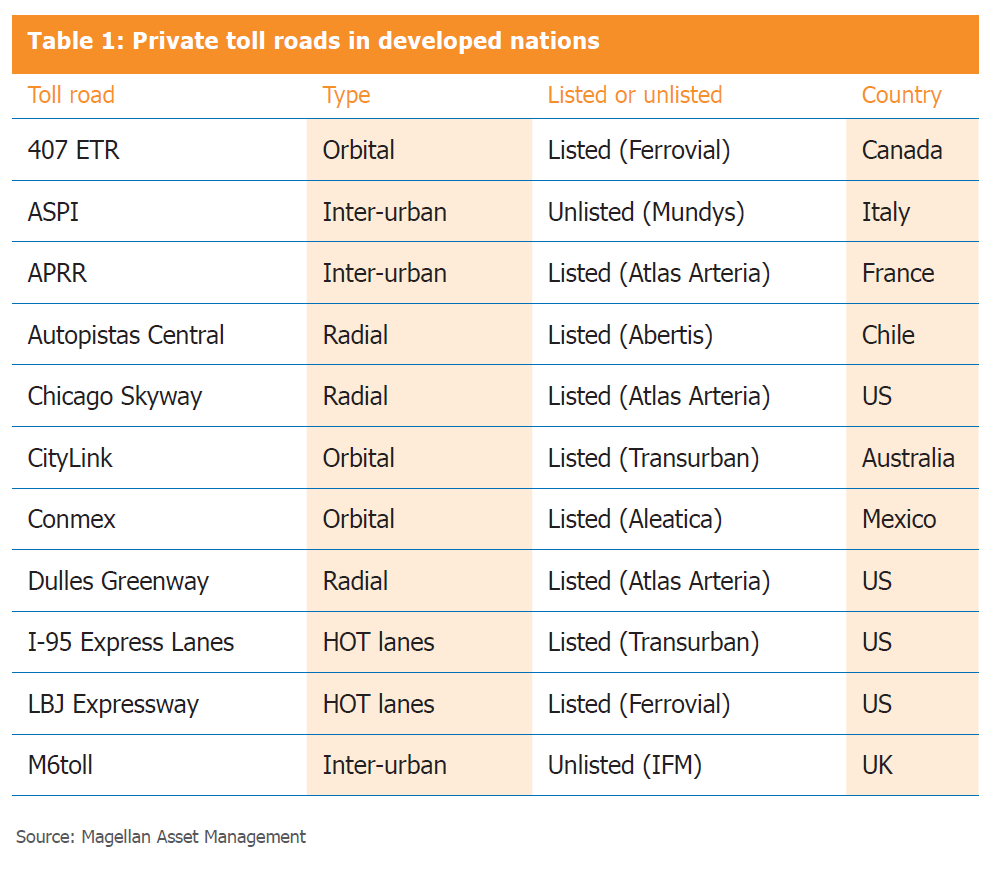
There are two main types of toll roads; inter-urban toll roads (those between cities); and intra-urban toll roads (those within cities), which can be further be divided into radial, orbital and high-occupancy toll (HOT) lanes.
Each road varies in terms of its dynamics but, in general, this difference stems from the types of users and the trips undertaken.
Intra-urban toll roads typically host a higher proportion of cars – with a significant part of this related to people traveling to and from work and going about their daily lives. Consequently, in an economic downturn, while some traffic will divert to the alternative free route, as long as people have jobs to go to or errands to run, the diversion is likely to be minimal. By contrast, roads between cities tend to have higher proportions of commercial traffic and discretionary trips, which are more economically sensitive.
Key Earnings Drivers
As is generally the case for transport infrastructure, the revenue for a toll road is a function of volume and price. In the case of toll roads, this can be put simply as: Toll road revenue = Traffic volume x toll price
Pricing Mechanism for toll roads?
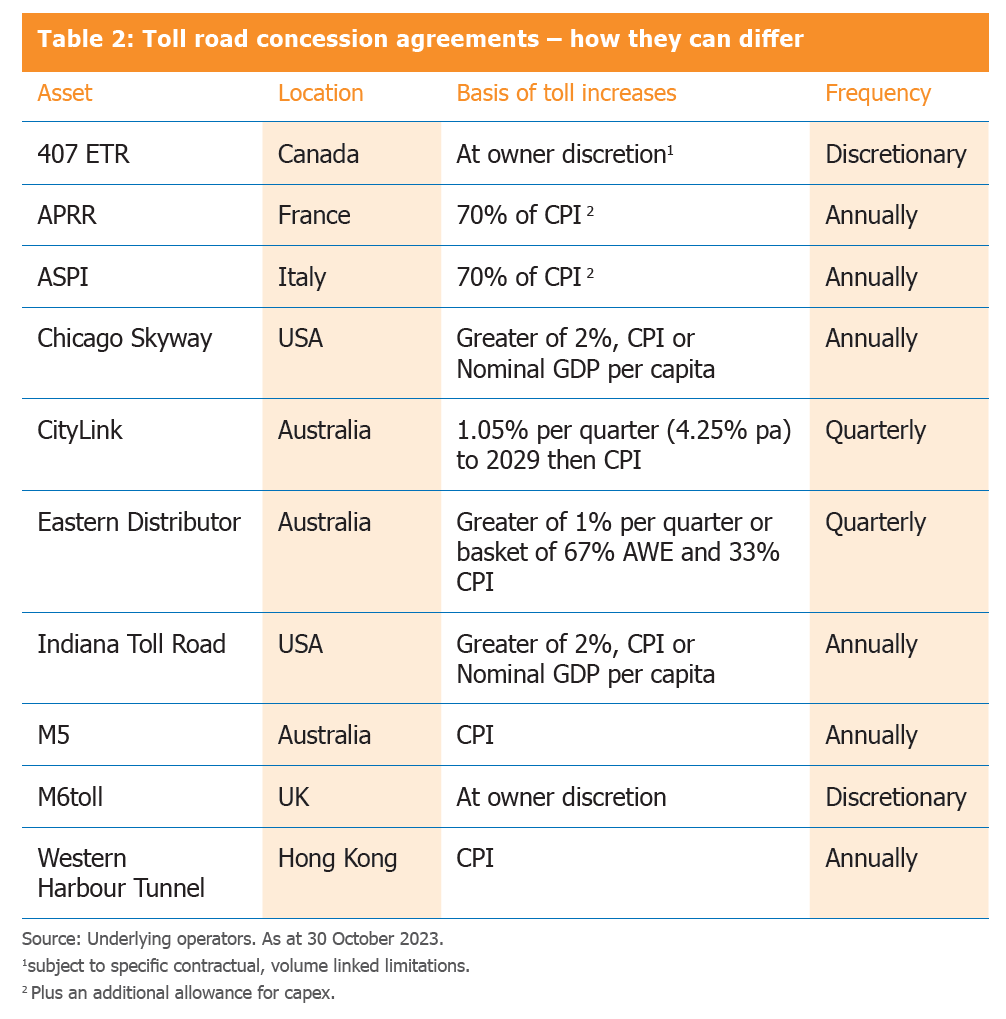
The typical business model for a toll road is that a government agency enters into a concession agreement (contract) that entitles a toll-road operator to collect tolls for a defined period and increase those tolls on a regular basis in a defined way.
The basis on which tolls are increased is controlled by the terms of the concession agreement and the level of tolls is generally linked to inflation. Table 2 shows how contracts differ. In Canada, the owner of the 407 ETR tollway can raise tolls with minimal constraints, while in Australia toll increases are linked to the consumer price index, the rate of inflation or 1 per cent per quarter.
The pricing mechanism for these toll roads generally tracks increases in inflation with minimal lag. Consequently, most toll-road owners have the ability to respond quickly to any rise in inflation.
The impact of price demand
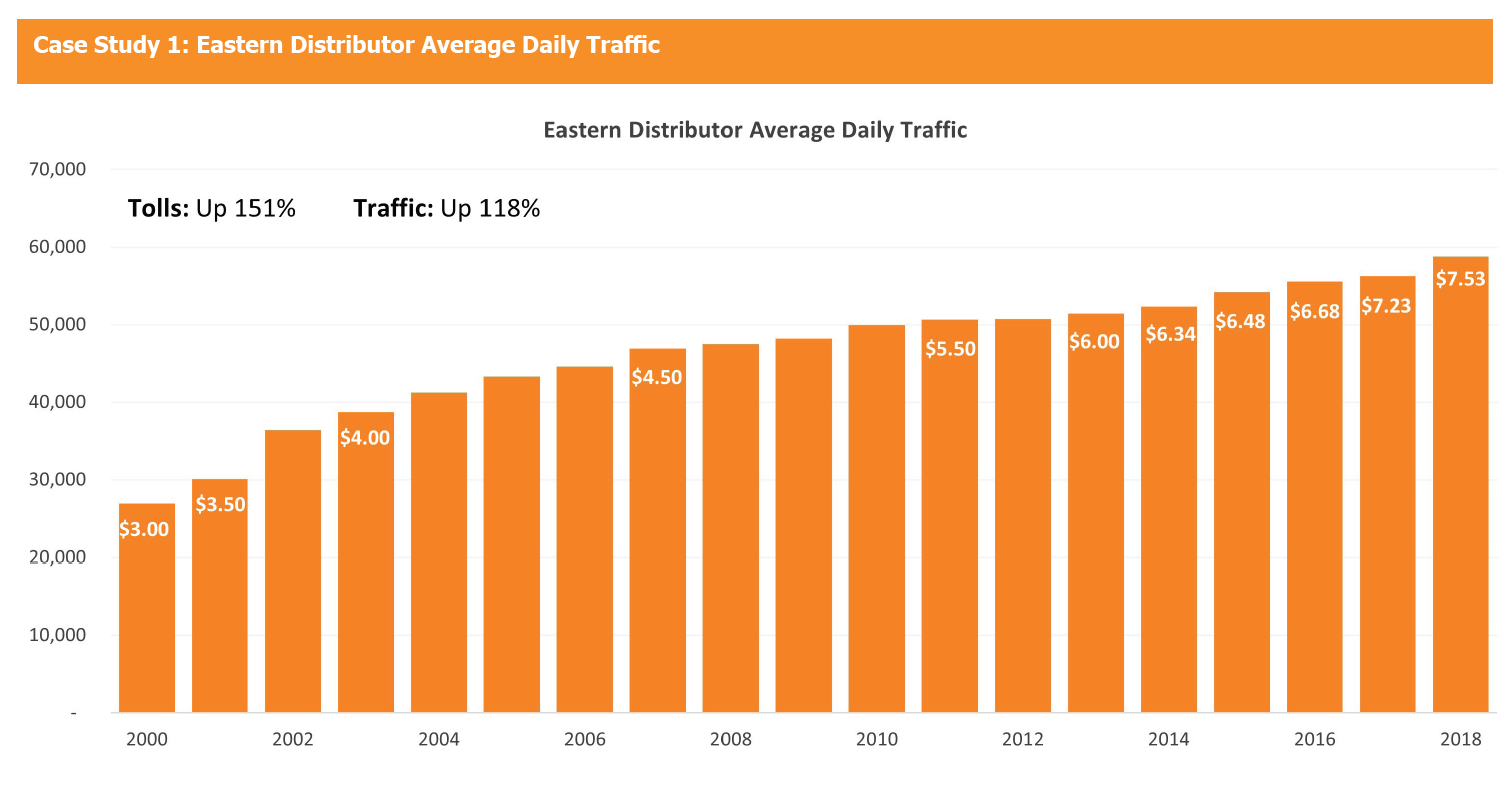
As tolls increase, there is generally a temporary switching effect where some users shift to the toll-free alternative. This causes competing routes to get more congested, which boosts the attractiveness of the tolled route. This results in an increase in total revenue, all things being equal, as the toll increase more than offsets the temporary decline in traffic. This can be seen from the below case study 1, that shows traffic on Sydney’s Eastern Distributor, which grew 118% over 18 years despite tolls increasing 151% over the same period.
The volume of traffic
Three main factors affect the volume of traffic on toll roads.
1. Trip-time certainty
A critical point in the decision-making process for drivers is how predictable travel times are. Drivers will pay a premium for a predictable trip and overestimate average driving times on trips with highly variable conditions.
2. Demand for toll roads is tied to economic development
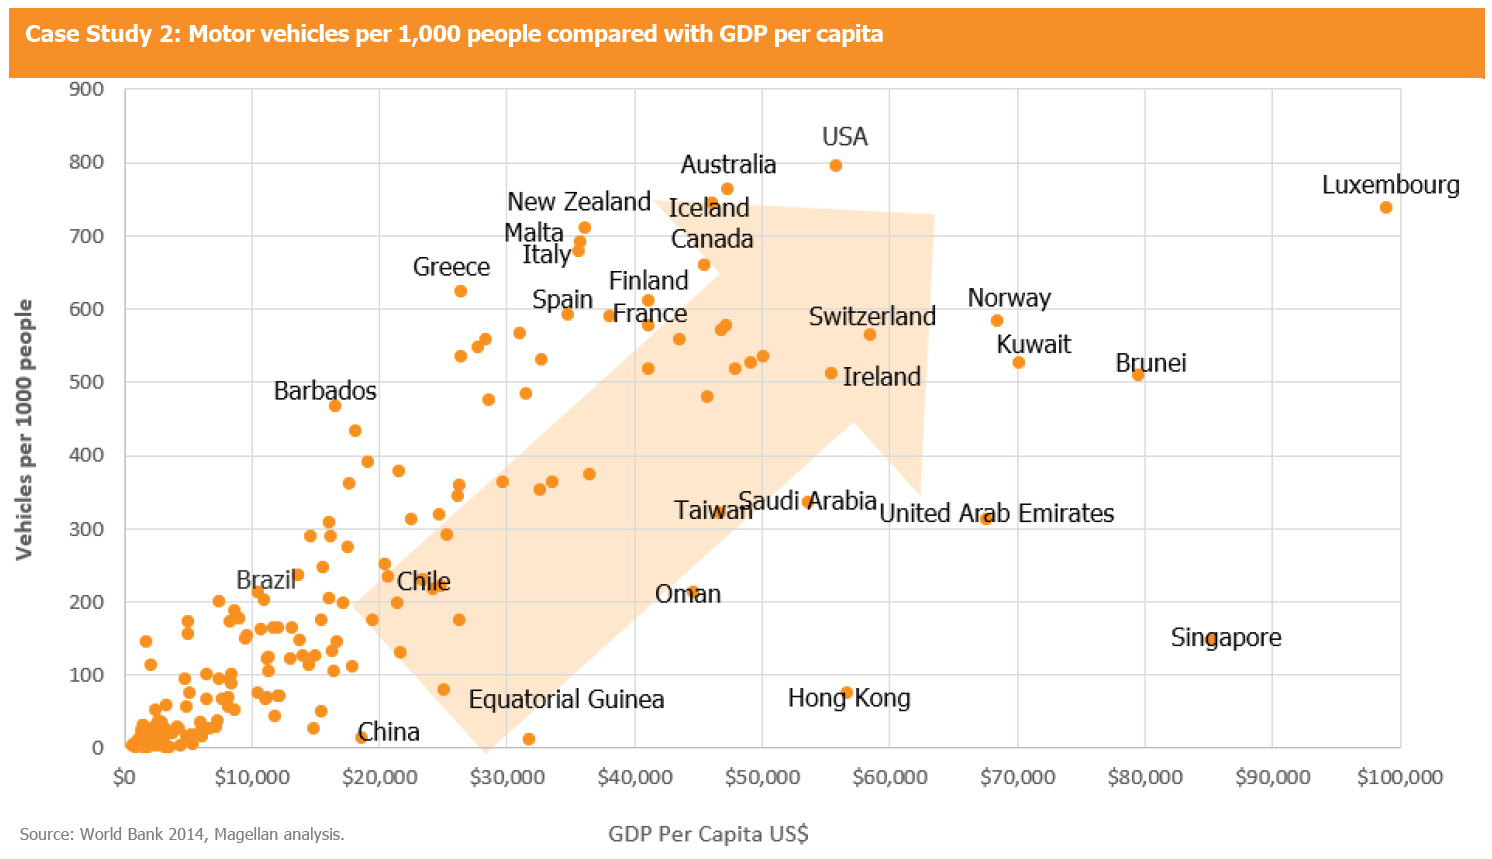
Experience shows that the demand for transport is related to economic development. Increases in populations and wealth lead to more demand for transport; in a growing economy, we can expect the number of vehicles on roads to rise over time.
Case Study 2 below, shows the number of cars per thousand people in different countries around the world. It shows that as countries become wealthier, the demand for transport and mobility leads to increases in car ownership. The direct relationship between the demand for transport and economic development underpins the need for transport infrastructure.
3. Capacity constraints on the existing network
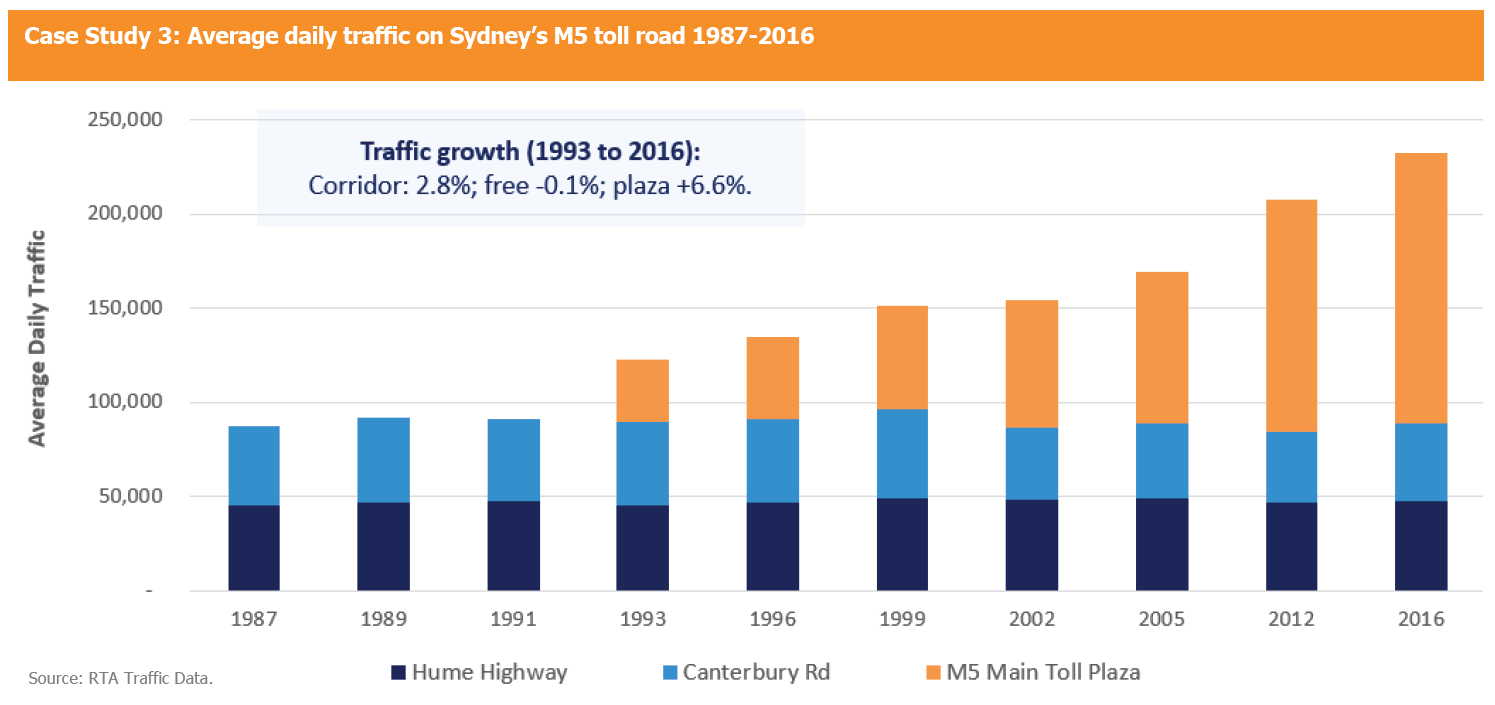
A new toll road is typically supported by governments to add capacity to a network that is at, or approaching, capacity. If alternative routes to the toll road are congested, traffic growth on toll roads is likely to be higher than that of the corridor for long periods of time. This is displayed below in case study 3, which shows the traffic along a key corridor in Sydney, Australia. It shows that, despite the addition of the M5 toll road in 1992, the average daily traffic on the existing network remained unchanged and all traffic growth in the corridor was via the toll road.
What are the risks?
1. Misalignment of incentives
A misalignment of incentives of management and advisers is the most fundamental risk to the financial success of a toll road. Recent history is littered with high-profile bankruptcies in toll roads located across the globe. Examples include the Cross City Tunnel, the Lane Cove Tunnel, the RiverCity Motorway and BrisConnections in Australia; the ITR, the SR125, the SR130, the Pocahontas Parkway and the Chicago Skyway in the US; and the M6toll in the UK. What these failures have in common is they were a result of misalignment of incentives, with (mostly) investment banks using highly aggressive traffic numbers and/or capital structures to generate investment banking fees or increase assets under management on which they could charge management fees. The other instances were largely where companies’ bonus structures rewarded growth in assets rather than long-term investment metrics.
This is one of the reasons Magellan places so much emphasis on the governance or agency risk of these businesses. Incentives drive behaviour. A management team with incentives that align with the needs of long-term asset owners is less prone to such errors.
2. Congestion charges
Eight cities including Milan, London, Singapore and Stockholm have congestion charges, aimed at reducing traffic in parts of the central business district, that largely have proved effective. Other cities, including Sydney, Australia and Washington DC, have considered such measures.
A congestion charge increases the cost of a trip into the charged area, which would be expected to shift people to other modes of transport; in particular, public transport. Other solutions such as Washington DC’s dynamic pricing on parking meters may also reduce traffic at the margins.
3. Technological disruption
As we have noted in our paper, ‘Self-driving cars – implications for toll roads’, we expect autonomous vehicles and driverless cars to prove positive for the earnings of toll roads over the next 10 to 20 years, particularly for urban toll roads.
Toll roads today typically can handle about 2,200 vehicles per lane per hour. A study by the University of California1 concluded that full penetration of self-driving cars could double this capacity. This is because computer-driven vehicles will be able to travel much closer together, at much higher speeds and in much thinner lanes.
The long-term impact on toll roads will depend on the balance between additional trips created by driverless cars minus the additional capacity that is created on the free roads
4. Working from Home
Working from home has been a more common working approach post-pandemic. However, we note that for most roads, commuter traffic only represents a minority of trips, with school-runs and other local trips representing the majority.
5. Declining licence uptake among younger adults
Much has been made about the decline in teenagers and people in their early 20s getting a driver’s licence.
In the University of Michigan study, the most common reason given for not getting a licence was that people said they were too busy (37%), followed by the cost of owning and maintaining a vehicle (32%). Interestingly, 31% said it was because people said it was so easy to get a lift from a friend. Ultimately, though, these people are more likely to get a car once they leave university and enter the workforce, and especially once they have children. This is supported by the NSW Household Travel Survey, which found weekday car trips by households with children were 3.9 times that of single-person households. Their main reason for using the car (22.7% of trips) was to ferry children around.
An Australian study into the same phenomenon2 suggested a range of explanations. Potential causes included increasingly restrictive access to learners and full licensing requirements along with lifestyle factors – increased tertiary education, staying at home longer and delaying working and having children, and the reduced status symbol of a car. The study found that young people who maintain frequent contact with friends through technology are more, not less, likely to see their friends in person.
Toll roads can generate growing and inflation-protected income streams for long-term investors. While the risks are low compared with most equities, the risks of these assets are nonetheless real – particularly when they pertain to agency risk. In-depth research and a good understanding of the drivers of the business and incentives of management teams should allow investors to reap the benefits of these largely misunderstood assets.
Important Information: This material has been delivered to you by Magellan Asset Management Limited ABN 31 120 593 946 AFS Licence No. 304 301 (‘Magellan’) and has been prepared for general information purposes only and must not be construed as investment advice or as an investment recommendation. This material does not take into account your investment objectives, financial situation or particular needs. This material does not constitute an offer or inducement to engage in an investment activity nor does it form part of any offer documentation, offer or invitation to purchase, sell or subscribe for interests in any type of investment product or service. You should obtain and consider the relevant Product Disclosure Statement (‘PDS’) and Target Market Determination (‘TMD’) and consider obtaining professional investment advice tailored to your specific circumstances before making a decision about whether to acquire, or continue to hold, the relevant financial product. A copy of the relevant PDS and TMD relating to a Magellan financial product may be obtained by calling +61 2 9235 4888 or by visiting www.magellangroup.com.au.
Past performance is not necessarily indicative of future results and no person guarantees the future performance of any financial product or service, the amount or timing of any return from it, that asset allocations will be met, that it will be able to implement its investment strategy or that its investment objectives will be achieved. This material may contain ‘forward-looking statements’. Actual events or results or the actual performance of a Magellan financial product or service may differ materially from those reflected or contemplated in such forward-looking statements.
This material may include data, research and other information from third party sources. Magellan makes no guarantee that such information is accurate, complete or timely and does not provide any warranties regarding results obtained from its use. This information is subject to change at any time and no person has any responsibility to update any of the information provided in this material. Statements contained in this material that are not historical facts are based on current expectations, estimates, projections, opinions and beliefs of Magellan. Such statements involve known and unknown risks, uncertainties and other factors, and undue reliance should not be placed thereon. No representation or warranty is made with respect to the accuracy or completeness of any of the information contained in this material. Magellan will not be responsible or liable for any losses arising from your use or reliance upon any part of the information contained in this material.
Any third party trademarks contained herein are the property of their respective owners and Magellan claims no ownership in, nor any affiliation with, such trademarks. Any third party trademarks that appear in this material are used for information purposes and only to identify the company names or brands of their respective owners. No affiliation, sponsorship or endorsement should be inferred from the use of these trademarks. This material and the information contained within it may not be reproduced, or disclosed, in whole or in part, without the prior written consent of Magellan.
